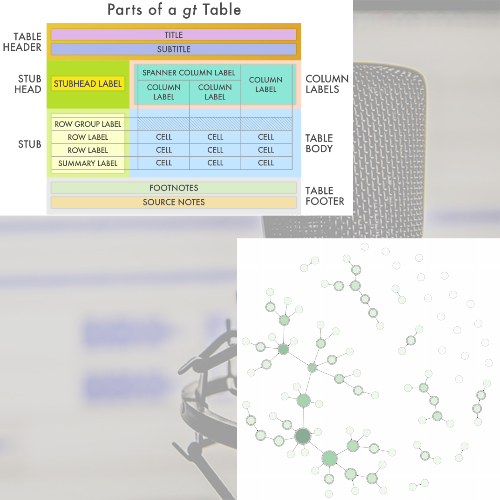
Episode 27: Get the {Gt} Tables! (Rstudio::conf 2019)
Posted on Monday, Feb 11, 2019 | Category: Podcast
Show Notes
Conversation with Rich Iannone
DiagrammeRpackage: visualizers.co/diagrammer/gtpackage: gt.rstudio.com/blastulapackage: github.com/rich-iannone/blastula
Preparing for the Shiny Modules talk
- Karl Browman’s rstudio::conf 2019 resources repo: github.com/kbroman/RStudioConf2019Slides
- Slides: bit.ly/modules2019
- Recording: resources.rstudio.com/rstudio-conf-2019/effective-use-of-shiny-modules-in-application-development
- Communication between modules article: shiny.rstudio.com/articles/communicate-bet-modules.html
- Ames Housing Explorer application: gallery.shinyapps.io/ames-explorer
shinypodpackage by Ian Lyttle: github.com/ijlyttle/shinypodshinysensepackage by Nick Strayer: github.com/nstrayer/shinysense- Giving your first data science talk by Emily Robinson: hookedondata.org/giving-your-first-data-science-talk/
- The Unreasonable Effectiveness of Public Work (David Robinson): slides and recording
Additional resources
- Tips on designing hex stickers for R packages (Hao Zhu): zhuhao.org/post/tips-on-designing-a-hex-sticker-for-rstats-packages/
Feedback
- Leave a comment on this episode’s post
- Email the show:
thercast[at]gmail.com - Use the R-Podcast contact page
- Leave a voicemail at
+1-269-849-9780
Music Credits
- Opening and closing themes: Training Montage by WillRock from the Return All Robots Remix Album at ocremix.org
Guests

Rich Iannone
My background is in programming, data analysis, and data visualization. Much of my current work involves a combination of data acquisition, statistical programming, tools development, and visualizing the results. I love creating software that helps people accomplish things. I regularly update several R package projects (all available on GitHub). One such package is called DiagrammeR and it’s great for creating network graphs and performing analyses on the graphs. One of the big draws for open-source development is the collaboration that comes with the process. I encourage anyone interested to ask questions, make recommendations, or even help out if so inclined!
Hosts

Eric Nantz
Eric Nantz is a principal research scientist at a large life sciences company, creating innovative analytical pipelines and capabilities supporting study designs and analyses. Outside of his day job, Eric is passionate about connecting with the R community as the creator/host of the R-Podcast, Shiny Developer Series, and a curator / podcast host for the R Weekly project. Plus, he likes to share his adventures with R and general computing on Twitch livestreams at twitch.tv/rpodcast.